
 |
| My phone just refuses to align correctly for overhead shots. |
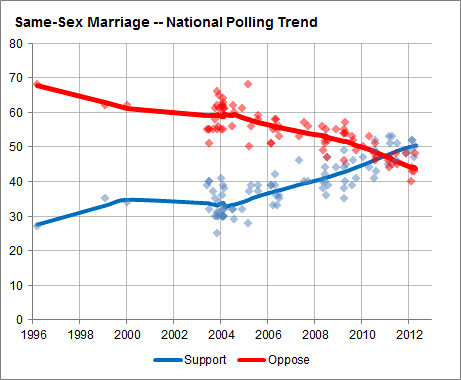
Remember last month when we had fun with population models? I wanted to do more of that today, based on this story in the NYTimes. The hypothesis was going to be that the increase in support for same sex marriage was a result of the changing demographics due to old people dying. I used this set of death rates (assuming they were constant in time), and selected the matching birth rate from here (again, assuming the 2005 numbers were constant). This immediately revealed itself as a bad set of assumptions, as you end up with functions that have two regimes:
- For t = 0 through t ~ max_lifetime, the system is working towards to normalizing the population cohorts based on the death rates. The birth rate keeps the system fed, ensuring that there are the right number at the population input.
- After t ~ max_lifetime, the population cohorts become stable, as they contain the steady-state fraction of the population. Total population increases exponentially (14.6 / 1000 > 825.9 / 100000).
However, that isn't really the question I wanted to answer, so it doesn't matter. Actually, given the assumption of near-steady state, the answer is obvious. The question I really wanted to answer is "what fraction of the total population was born after some date, set such that people born after that date don't really care about same-sex relations." If I had proper rates for all time, I could probably tie this date down, but I suspect it's something like "1970ish, or maybe like sometime in the 60's." In any case, knowing that in the steady state you introduce some new fraction F of the population each year as new births, after N years, people born after that date comprise something like N * F of the total population. Therefore, the fraction is roughly linear in time. Go back, look at plot, squint. Yeah, I think I can buy that as an explanation for that plot.
- On the subject of same-sex marriage (bottom center story).
- If you're reading about memes in the NYTimes, you are the definition of doing it wrong.
- Ninja squirrel!
- Yet another reason why Facebook is a terrible idea.
No comments:
Post a Comment